ARTICLE SUMMARY
Learn why Pipefy’s customizable accounts receivable dashboard is key for collecting important business intelligence and improving your process.

The accounts receivable process plays a crucial role in your business: keeping your company’s cash flow moving along and making sure you can pay your bills. At its core, the purpose of the accounts receivable process is to collect payments from customers. This may sound simple and straightforward, but there are many moving parts that make the process work — and many possible glitches and inefficiencies that can keep the process from running smoothly.
Building an organized and healthy A/R process begins with seeing and understanding how your process works. Pipefy’s A/R Dashboard helps you do that. To better understand how improving data visibility can help your accounts receivable process, let’s do a quick review of Pipefy Dashboards.
Definitive Guide to Workflow ManagementDownload guide
What is an accounts receivable dashboard?
Your A/R dashboard gathers and organizes crucial information into a visual format that allows you to quickly understand your accounts receivable process. The no-code interface makes it easy to build dashboards at scale.

Benefits of tracking accounts receivable metrics with dashboards
| Make informed, data-driven decision | – Extending payment timelines – Incentivizing customers with early payment discounts |
Identify and eliminate process bottlenecks | – No more PO matching issues or missing invoices |
| Visualize data in various formats depending on your needs | – Line or bar graphs – Pie charts – Tables |
Pipefy dashboard terminology
In order to understand how to build and use a dashboard, it’s important to become familiar with important dashboard terms: metrics, dimensions, time, and filters.

How to set up dashboards for your accounts receivable process
Before getting started, it’s important to consider the data you want to track and analyze. Not sure what data to track with your dashboard? Consider these key accounts receivable reporting metrics for a comprehensive look of your accounts receivable process.
13 accounts receivable reporting metrics to keep tabs on
- Number of total purchase orders received (by phase or per customer)
- Total time to pay
- Requests paid on time, late, and/or invoices approaching due dates
- Money due to be paid
- Money paid
- Percent of payments received within the deadline
- Total days in accounts receivables
- Payment processing error rate
- Compliance rate
- Processing cost per invoice
- Payment methods
- Average invoice value
- Products sold/services provided
Building your accounts receivable process
Once you determine what to track, it’s time to decide how you want to build your dashboard. With Pipefy, you have two options: build a dashboard from scratch or a pre-built dashboard included with the accounts receivable process template.
The pre-built dashboard is great for anyone interested in getting started quickly and with a roadmap to guide their dashboard creation. For a more tailored approach, dashboards can be configured quickly and easily using a no-code, drag-and-drop interface.
To build your own dashboard from scratch, follow these four steps:
1. Access the Dashboards tool in your accounts receivable process pipe’s header.
2. Next, click on create dashboard.
3. Then, select add chart and start building your Dashboard.
4. Use the metric, dimension, and time values to start sorting through your information and pulling in organized data.
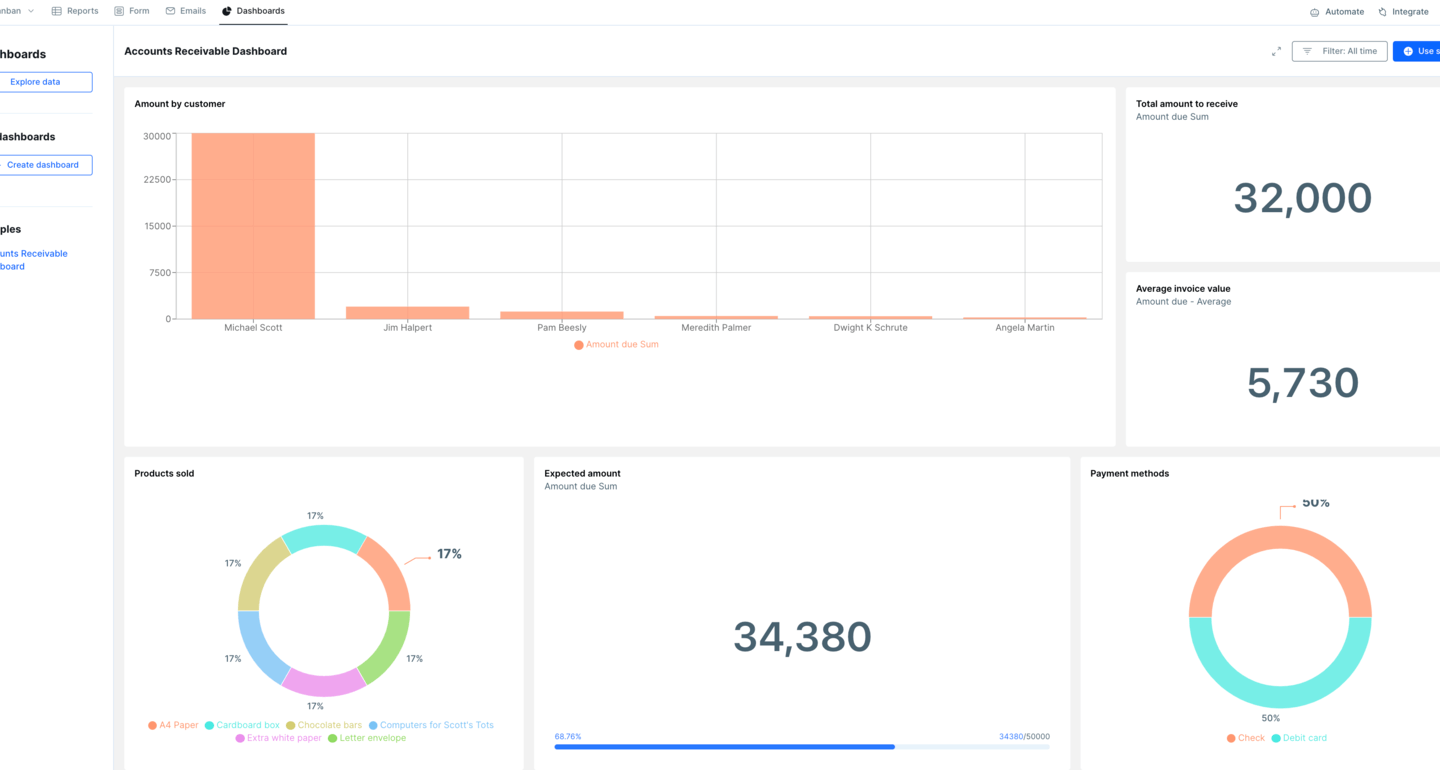
Accounts receivable dashboard example
Watch this video for a comprehensive walkthrough of Pipefy’s Dashboards features.
Pipefy dashboard tips
As you build and customize your dashboard, keep these tips in mind:
- In addition to metrics, dimensions, and time, use filters to further define your data.
- For a quick view of your accounts receivable process, create a table that automatically updates the status of requests.
- If filtering by date, only charts that have a defined time will appear.
- If you’re working with the dashboard template, avoid deleting fields in sample dashboards. Because these are pre-built, it may break the functionality.
Manage your accounts receivable with Pipefy dashboards
Cash flow is crucial to your business. Late payments, missing invoices, and disorganized workflows can impact your cash flow and keep you from paying your bills on time.
Pipefy dashboards give you control over your data and insight into how to improve your A/R process and keep your company’s finances healthy.


