ARTICLE SUMMARY
By tracking the processes, it’s possible to find opportunities for improvement—something you will identify through a (ta-da) Value Stream Mapping (VSM).
Have you ever wondered about the number of steps that things around you have to go through before acquiring the final shape you see? We’re talking about services, smartphones, furniture, clothing, and even food. Everything that surrounds us had to go through some kind of process before coming to us. There’s tons of invisible work a company invests in to secure customers.
These processes usually remain in the background and have a direct impact on Lead Time and Cycle Time. Don’t worry, we will explain the jargon later, but for now, keep this in mind: they influence key points like quality, price, and profitability. By tracking the processes, it’s possible to find opportunities for process improvements. You can identify these opportunities with value stream mapping (VSM).
What is value stream mapping (VSM)?
Value stream mapping is an essential method for any company that aims for better outcomes. There are several practices that help you accomplish outstanding results, but none of them are as effective as Lean. VSM is one of the pillars of lean management.
See how no-code automation improves business processes without burning out the IT team. No-code Automation: Good for Business, Great for IT
History of value stream mapping
The first version of the VSM was developed in the Toyota Production System (TPS) back in the 40s, but only later transformed into the tool that we know today. The earliest versions of VSMs were quite complex and industry-oriented (and it still holds a huge industry interest today). You can see an example of a traditional factory VSM below. Yes, it can be scary, but stick around and you will soon understand how to make this a simple and effective method for you.
Note that the VSM term was only popularized in the 90s by different professionals and scholars, such as James Womack and Daniel Jones with the book Lean Thinking. Until then, most of the Lean concepts were restricted to factories of mass production. Luckily, for the sake of better processes and business, things changed when Lean and VSM spread to other fields.
Why do value stream mapping?
The purpose of value stream mapping is to maximize value for customers and for the business. Value stream mapping supports these efforts by identifying waste and inefficiencies, and then helping process managers solve them. Value stream mapping helps businesses stay competitive through better management of their resources and by unlocking more value for their customers.
What are the benefits of value stream mapping?
A value stream is composed of each step necessary to bring demand from its early stages to its final ones, and a value stream map displays all steps required. Here are the two primary ways VSM improves all types of business processes:
Helps delivers value to the customer
Whether they are external or internal (like in an HR department, where the customers are the other employees), the customer experience should always be the focus. Value stream mapping helps build processes that are customer-centric.
Serves as a process improvement guide
With the “big picture” of processes fully drawn out, it becomes easier to identify improvement opportunities or processes that aren’t producing the desired outcome.
VSM is a compass that helps you visualize and guide your actions throughout any process of development. Through it you will be able to:
- See the flow of your entire chain.
- Identify wastes and their sources.
- Form the foundation of an improvement plan.
- Make flow decisions visible to the entire team.
- Set which actions will be taken to achieve the goals.
Current and future states
It’s fundamental to have a holistic view of your workflow. Only then will things truly evolve. The goal here is to improve everything that can be improved—not just isolated phases of the process. That’s why at the end of the VSM, you’ll always be left with two scenarios: one representing the current state and another representing the future state.
The current state is how your value stream works right now and the future state is the goal to be achieved. The future state is built by identifying wastes of the current state and dropping them to the max. Note that this is cyclical. Whenever you reach your future state, it becomes your current state, so there’s always room for more improvement.
Example value stream map
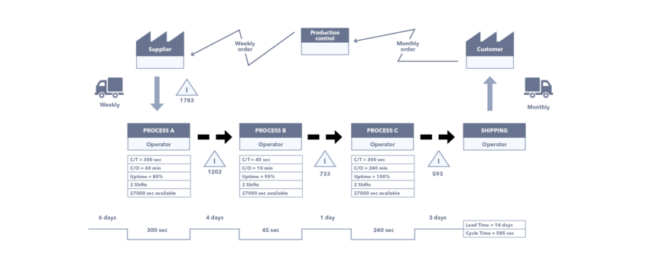
All these boxes, symbols and arrows represent specific actions, interactions, people and periods required to deliver a service or a product to the customer. This model is just for your reference, so don’t focus on fully understanding it. Although this is an example of a classic VSM, most markets (mainly services) will have VSMs that look a little simpler than this one.
Elements of a value stream map
Before jumping into how to design a proper VSM, it’s helpful to see all the elements that make up a value stream map.

Information flow
Data that’s relevant for the development of the process, such as details of the activity, the name of the person responsible for each task, and which resources are required to complete the task.
Process flow
A visual representation of the sequence of the process. Each task or activity in the process should be identified, and the direction or routing of the process should be indicated.
Lead time
The amount of time it takes to move items from one task to the next. This includes time the items spends idle or on hold.
Cycle time
The amount of time it takes to complete task. Runtime of the task when it’s not on hold.
Percent C&A
The ratio of times the process outcome is successful, requiring no rework.
Takt time
Although not shown in the diagram, another component of VSM takt time. This is total time the process requires divided by customer demand. For example, for someone who works six hours per day in a call center and takes about 180 calls daily, the Takt Time would be two minutes per call.
Takt time is relatively easy to calculate for a structured process. However, things change when we talk about unstructured processes, or processes that don’t follow a consistent pattern. In those cases, you won’t be able to calculate a reliable measure of takt time.
Find the right automation tool with the Buyer’s Guide to Automation Platforms
How to create a value stream map for the current state
Now that you’re familiar with its components, let’s learn how to build your VSM. Keep in mind that as we build the VSM, we’re talking about the current state. In this state, bottlenecks and wastes must be highlighted in order to be eliminated.
If you feel the need, it’s possible to do a Gemba Walk (a walk through the place where the work happens) to discuss with everyone involved in the process. This way you can better understand the whole process to then put it into the VSM. Any VSM is a collaborative tool that employees from different hierarchical levels can engage in to help to build the most accurate version.
To build your end-to-end, current state VSM from scratch, follow this six-step path:
Step 1: Select the process to be mapped.
Let’s suppose we’re analyzing the purchase process that happens in a company called ACME. Note that this process only applies to purchases over US $5,000.
To maintain security and compliance requirements, the process must include the following steps:
- The employee uses an MS Excel template to fill out the purchase order request.
- The employee emails the request to the financial manager, who checks the budget.
- The team leader reviews the request by email as does the area manager.
- The general manager analyzes the request to then pass it to the procurement analyst.
- The analyst enters the request on the ERP system for the procurement manager.
- The procurement manager finally approves the request through the ERP system.
- The purchase order is finally sent to the supplier and the process is finished.
Step 2: Designate who is responsible for what (everybody in the process).
With this information, we can now identify who is involved in this process: the employee, the financial manager, the team leader, the area manager, the general manager, the procurement analyst, the procurement manager, and the supplier.
Step 3: Define how each task is done
This step is all about breaking down the people involved route tasks through a process. This can be anything like communicating face to face, via, email, with apps, etc.
Based on the information in Step 1, here’s how the work gets done: MS Excel template, emails, and an ERP system. Note: There was some communication and collaboration that occurred in Step 1, but it was not clear how it occurred. For details like this, it’s important to follow up with the people involved for a detailed understanding.
Step 4: Calculate metrics.
This includes information like lead time, cycle time, and the percent of C&A.
Key metrics as they’ll be essential to analyze future opportunities for improvement. Also, C&A Percentage plays a vital role in this evaluation. It can be calculated by measuring the percentage of tasks done right the first time. The objective is to detail the entire process flow allowing anyone to easily pinpoint bottlenecks and wastes that can be targeted.
Step 5: Sketch the value stream of it (appoint all of its stages in columns).
With the information from Steps 1-4, it’s now time to jot all that information down. Following the VSM framework we presented before, here’s how the current state would be drawn.

Step 6: Stand back to analyze.
After the VSM is completed, it is important to reflect and assess whether it works. Don’t be afraid to redraw the VSM if necessary and to talk to the people involved in the process until you get the most accurate representation of it.
This VSM model can be adapted to multiple scenarios. This is not and should not be the only template you can use, so feel free to tailor it to whatever best suits your needs. Also, plenty of VSMs have both data and material flow combined together, while others map just data flow (mainly office ones). Once the current state is ready, it’s time to project the future state.
How to create a value stream map for the future state
The future state is the desirable state you want to reach according to the data you’ve collected from the current state. To design a feasible projection, it’s recommended to examine the value stream with picky eyes to diagnose areas of waste, overprocessing, and bottlenecks that may not be so easy to identify.
Step 1: Outline what needs to be improved
To help you out follow this query:
- What is the fundamental problem that needs to be solved?
- What bottlenecks stop or delay the flow of the process?
- What phases of the process have low C&A? Why?
- What process have overly long lead times? Why?
- Is it possible to find redundant phases or activities?
- Are technology tools being used to the best of their abilities?
- Is it necessary to adjust internal policies?
- Are employees performing their task the best they can?
Lean concepts and practices can help you answer such questions in an easier way. Techniques like the 5 Whys (questioning yourself and your team five times until reaching the root cause of an issue) and concepts like Jidoka (a lean method of quickly identifying and resolving the cause of product flaws) provide exceptional approaches to how to solve a problem. VSM works more smoothly when aligned with lean.
Step 2: Detail how people use tools and resources to complete the process
Moving back to the ACME example: once the employees involved in the process studied the current state VSM, it was evident that a lot of changes were needed. There were just too many people included in the process, not to mention the bureaucracy of it and the lack of a better and integrated system to connect every step.
The flow was piling up in several places due to the long, overly complex process to acquire the purchased item. The general manager usually had 16 requests waiting for approval while the procurement manager often had more than 42 requests to review. Both of them were huge bottlenecks due to the fact that they couldn’t handle the massive volume of requests per day.
MS Excel was also a major concern since it was not error-proofing or streamlined. People could easily make mistakes with the archive since it wasn’t clear. Overall, the whole process was too big and unnecessarily bureaucratic.
Step 3: Map out the future state
With all this in mind, they designed the future state VSM:

Check out the benefits accomplished through the Value Stream Mapping:
- The process involves fewer people, the ones that really matter.
- With only four phases, the steps were cut so the process moved quicker.
- MS Excel was thrown away as well as the requests by email that pile up.
- ACME began to use Pipefy to connect and centralize requests for everyone involved.
The impact of Pipefy
Pipefy has error-proofing mechanisms that drastically increase the C&A percentage. The requests were filled more easily and sent through the platform to the next responsible, allowing anyone to see which stage the request was. Also, all employees were emailed when the request took more than one day to be approved for the next step. Check out the improved metrics:
- People involved in the process dropped from eight to four.
- Lead Time was remarkably reduced from 9 days to 2.5 days.
- Cycle Time had a significant decrease from 120 min to 55 minutes.
- Percentage of C&A went from 0.5% to 89% (an outstanding success).
The great blast of this VSM was the Percentage of C&A that went from 0.5% to 89% with the combined help of Pipefy, the exclusion of MS Excel, and the decline of people involved in the process. Also, the future state shows that there will be no more than two requests queued up before the procurement manager and buyer. Growth in all aspects!
Why continuous improvement is important
Once the future state is set it is time for a change. The first step is to create a PDCA (or action plan) to implement all the mapped adjustments in the process. The easiest way to do that is by splitting up the future state into smaller pieces and improving one segment at a time.
The changes will happen phase by phase and may take a while according to the process you’ve mapped. But rest assured that when everything is up-to-date and streamlined, you’ll have the greatest version of the process (at least for that moment). However, the cycle of improvement doesn’t end here. It’s a never-ending effort that should be intrinsic to the company’s culture. Keep in mind that this is a long journey of continuous improvement or, in Lean terms, Kaizen, so when you reach your future state, it automatically becomes your current state.

Always ask yourself: is it possible to deliver more value in a better way? You’ll answer in the affirmative the majority of the time. So why not always strive for the best?
Lean tools such as Value Stream Mapping help you and your organization accomplish a state of balance that truly transforms the way your whole operation works, constantly aiming for continuous improvement.