ARTICLE SUMMARY
With Pipefy Dashboards, you can harness the power of important business intelligence to improve your accounts payable process.

While accounts receivable (A/R) deals with money that is owed to a company, accounts payable (A/P) deals with money that is owed by a company. Keeping up with your accounts payable process is essential to reaching financial goals and building your reputation as a trusted partner with suppliers.
This process, while it may sound straightforward, can take a wide range of team members, complex tasks, and accounting tools to get a company’s bills paid on time.
But like any other process, issues may arise and keep the process from running smoothly. In order to address the issues that may be affecting your accounts payable process, you first have to analyze trends and patterns.
To better understand how they may help your accounts payable process, let’s do a quick review of Pipefy Dashboards.
Definitive Guide to Workflow ManagementDownload guide
What is an accounts payable dashboard?
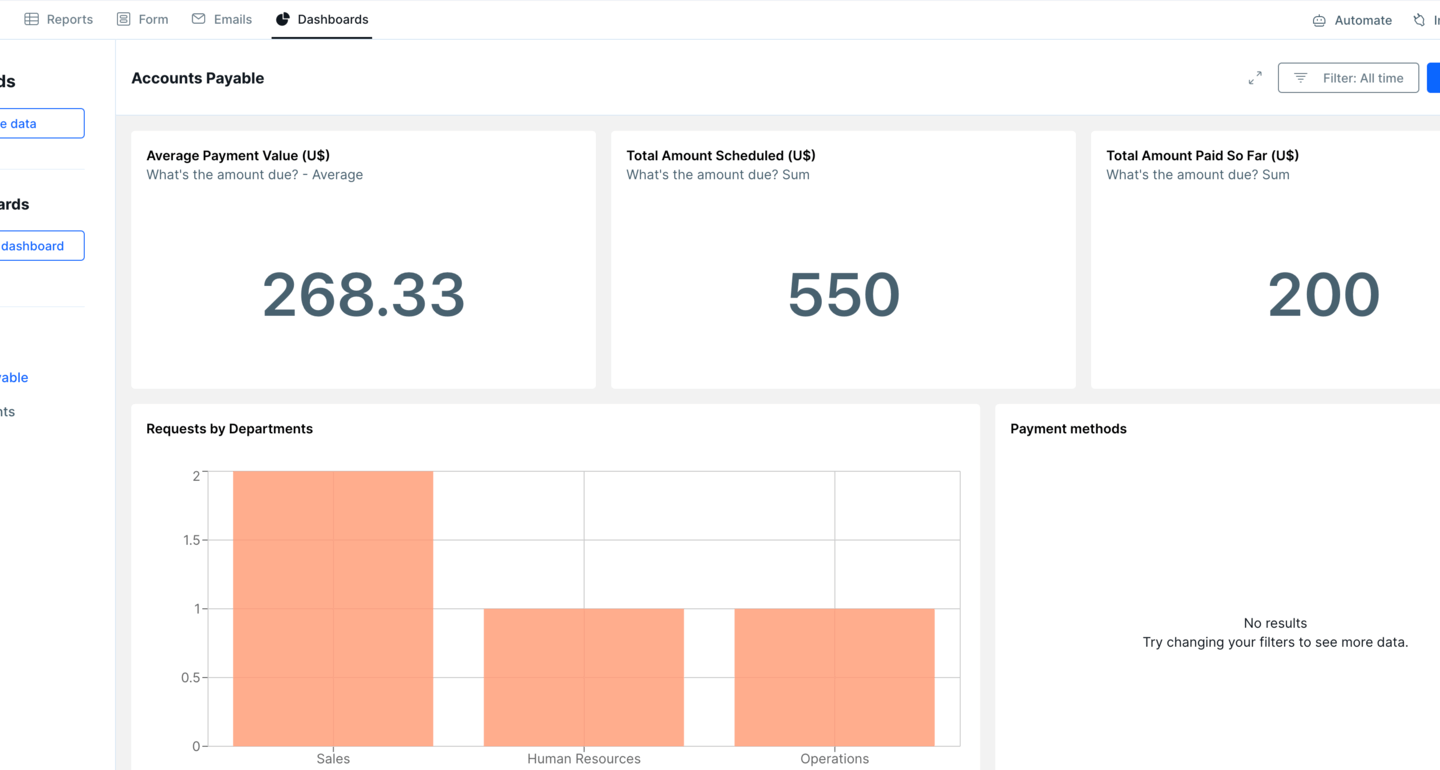
Pipefy’s customizable dashboards are a source for organizing and viewing key accounts payable metrics. Dashboards translate raw data into easily digestible visualizations, making it easy to extract, filter, and evaluate data in order to continuously improve your process and business. The no-code, drag-and-drop interface makes it easy to build dashboards that reflect your A/P process and which scale and adapt as your business grows.
Benefits of dashboards for accounts payable process improvement
With the powerful business intelligence provided by dashboards, teams are able to:
- Make informed, data-driven decisions related to company purchases or expenses.
- Find and eliminate process bottlenecks, like late payments or delayed purchase approvals.
- Visualize data in various formats depending on your needs, including lines, bars, areas, pie, charts, and numbers.
Pipefy Dashboards terminology
In order to understand how to build and use a dashboard, it’s important to become familiar with important dashboard terms: metrics, dimensions, time, and filters.

| Check out this helpful article to learn more about Pipefy’s native business intelligence tool. |
21 metrics to highlight in your acocunts payable dashboard
Before you start building an accounts payable dashboard, the first step is choosing the information you want to highlight. Here are 21 accounts payable metrics Pipefy Dashboards can track:
- Number of requests received and completed
- Requests by process phase
- Status of requests
- Requests received per vendor
- Total spent vs budget
- Money due to be paid
- Total time to pay
- Requests paid (on time or late)
- Percent of payments received within the deadline
- Total days in accounts payable
- Payment processing error rate
- Processing cost per invoice
- Purchase requests created per company department
- Dollars spent per company department
- Berry ratio
- Transactions error rate
- Compliance rate
- Supplier rate
- PO and invoice accuracy
- Rate of emergency purchases
- Payment methods
| Learn more about how to manage your accounts payable process with Pipefy |
Building your accounts payable dashboard
Once you determine what to track, it’s time to decide how you want to build your dashboard. With Pipefy, you have two options: build a dashboard from scratch or use a pre-built dashboard that’s included with Pipefy’s accounts payable process template.
If you need a ready-to-launch A/P dashboard, Pipefy’s pre-built template can have you up and running in minutes. If you already have an idea of what you want to track and are interested in creating a custom dashboard, you may want to start from scratch.
To build your own dashboard from top to bottom, follow these four steps:
1. Access the Dashboards tool in your accounts payable process pipe’s header.
2. Next, click on create dashboard.
3. Then, select add chart and start building your Dashboard.
4. Use the metric, dimension, and time values to start sorting through your information and pulling in organized data.
| Watch this video for a comprehensive walkthrough of Pipefy’s Dashboards features. |
Pipefy Dashboards tips
As you build and customize your dashboard, keep these tips in mind.
- Use filters and labels to zoom in on specific accounts, invoices, or details.
- Create a table to see the status of all requests in real time.
- Avoid deleting fields in template Dashboards. Because these are pre-built, it may break the functionality.
- When filtering by date, only charts that have a defined time will appear.
Tap into your business intelligence with Pipefy’s accounts payable dashboard
A disorganized accounts payable process can have consequences like missed discounts, late fees, and additional work for your finance team. Because of that, you need a accounts payable software!
Pipefy Dashboards give you the control and insights you need to improve your accounts payable process and eliminate the inefficiencies that can cost your company time and money.


