ARTICLE SUMMARY
Learn what process mapping is used for, how to create your own process map step by step, and find the right tools to achieve your process related goals.

Last reviewed and updated by Team Pipefy on .
What is process mapping?
Process mapping is the practice of illustrating processes in order to better understand how they work and how they are organized. A process map uses flowchart symbols to represent all the tasks, activities, and information that compose a particular process. Learn in this blog post how to get started with process mapping.
Using a workflow diagram, the goal of process mapping is to achieve a clearer understanding of how a process — or how many processes — interact and actually work. By mapping your processes, you can learn the following:
- Define what a business does.
- Understand who is responsible for what within a process.
- Determine the start (what kicks off a process) and endpoint (the output or final result of a process).
- Identify the elements that make (as well as keep) a process from being successful.
Business process mapping also allows you to pick a specific objective and measure, track and compare this specific point alongside your business’ overall objective. By doing so, you’re able to determine whether a specific process is aligned with the company’s general goals and capabilities.
Build better processes with the Definitive Guide to Process Automation
Why is business process mapping important?
With process mapping, you can easily gain an overview of how processes are carried out, how they can be improved or constrained, and how many steps are necessary to drive the process to its endpoint. Mapping can be used for any type of business process, including:
- Core processes (create value for customers and generate revenue).
- Support processes (activities that make the business possible).
- Long-tail processes (unique, custom, or ad hoc workflows that emerge in response to changing business needs or increasing stack complexity).
Some organizations use process maps like workflow diagrams for procedural tasks, so employees know the correct order to follow in a process workflow. Generally, the result of process mapping is done in order to establish company execution standards or procedures.
Why use a business process map?
There are three key reasons for using a process map:
1. To assess and maintain the effectiveness and usability of existing business processes.
A process map is a great way to assess how well a business process is performing, and whether the existing process is structured effectively and producing the best output or user experience.
2. To keep an eye on bottlenecks, constraints, or continuous process improvements that can be made.
A process map can also be used to determine whether a process is creating unintended challenges that can delay process outputs and strain the process or the people, tools, or information involved. With a business process fully mapped, brainstorming improvements is made much easier.
3. To define and establish company execution standards or procedures.
Generally, the result of process mapping includes documenting the full scope of a process, such as start (or process triggers) and endpoints (or outputs), steps, owners, tasks, tools, documents, timelines, and handoffs.
This documentation not only increases collective knowledge, but it also ensures process consistency and reduces the risk of non-compliance or errors. It’s also done to define repeatable process standards or procedures.
Process mapping vs. workflow mapping
Business process mapping and workflow mapping are often used interchangeably, but there’s a clear difference between the two practices. To illustrate the difference between process mapping and workflow mapping, imagine that you’re going on a trip:
- Process mapping will show you the space between Point A and Point B.
- Workflow mapping will provide important information like turns, tolls, rest stops, road closures and whatever else is critical to successfully completing the trip.
Applying that logic to a business process, a process map shows you the full picture — such as start point and endpoint — and a workflow map breaks down everything that happens between those two points — such as who’s involved, when they’re involved, and the tasks that need to be finished — in order for the process to be completed.
For a better understanding of digital workflow and process, let’s get back to the basics. A workflow is a set of repeatable steps that produce a single outcome. A process is a broader group of activities that typically includes one or more workflows.
Benefits of using business process mapping and workflow mapping together
Simultaneously practicing both methods can improve existing processes by:
- Tracking the amount of time it takes to complete a process
- Finding process bottlenecks
- Enforcing execution standards with required fields or approvals
- Determining which tasks can be automated
Learn more: How to create automated workflows in Pipefy
Build better processes with the Definitive Guide to Workflow Management
When to develop a process map
If your immediate goal is to improve efficiency, then it might be time to create a process map in order to get a big-picture view of your process before diving into more detailed improvements.
It may be helpful to hire consultants to evaluate your processes, but this can also be done in-house with the help of a low-code workflow builder.
In addition to efficiency, here are 5 times a process map is needed when:
- Additional insight into a process is needed.
- Teams need to brainstorm process improvement ideas.
- Teams want to increase communication.
- Process documentation is missing.
- Teams need to identify bottlenecks that are creating delays, confusion, or rework.
Once your process is mapped, it becomes easier to move toward initiatives like AI task automation, helping teams streamline tasks and boost productivity.
Process mapping best practices
Whether you’re building a new process from scratch or want to document an existing process, consider these best practices to help you start mapping your processes.
Start with an existing diagram example
While there are many to choose from, what they all have in common is the ability to provide a clearer understanding of activities, flow, people, and resources involved in the process — from start to finish. (Skip ahead to the section on common process mapping examples to choose from some popular diagram options.)
Customize your map to fit your needs and level of detail
While there isn’t a universal way to map a business process, you should choose a process mapping methodology that addresses the level of detail you seek.
Don’t be afraid to use more than one diagram
In some cases, the diagrams can even be complementary to one another: use a VSM diagram to understand the big picture and value delivered to your customers, a BPMN diagram if you want functional flowcharts and a better understanding of where the information comes and goes, and a SIPOC diagram for a detailed understanding of inputs and outputs.
Seek input from the people that manage or work within the process
In order to effectively map a process, it’s important to connect with the people or teams that are involved with the process or manage its day-to-day operations. This inside knowledge is necessary for documenting and mapping a process as accurately as possible.
How to create a process map: a step-by-step guide
Now that you know what process mapping is, the advantages of mapping your process, and the three common diagrams used to map a process, it’s time to start your own. If you’re in doubt of which to use, we recommend starting with the SIPOC diagram.
Use these eight steps to create your map and design an efficient process.
1. Identify the process you want to map and why
Whether it’s a process that needs to be improved or a process that needs to be defined and documented, identifying the process that’s being mapped and the reason why is the first step to creating a precise and detailed process map.
Setting a goal for your process map — like improving communication, eliminating bottlenecks causing delays, or adjusting to better meet team bandwidth — helps inform the accuracy of your process map and informs any adjustments that need to be made.
To help you decide which process to begin with, consider starting with:
- Processes that have little to no documentation.
- Processes that are historically difficult to manage or maintain.
- Processes that are of high value (direct impact on customers or revenue).
- Processes that are high touch (multiple teams or departments use this process and rely on it to work effectively).
2. Collect important process information
For this step, the goal is to gather all the information you can. This is where you’ll truly understand how things happen within your process. Identify what people do, why they do it, how long it takes for them to do it, and what resources they need to do it. Whether you shadow employees or conduct interviews to collect the information needed, don’t forget to write it down.
3. Identify suppliers and customers
In addition to the team responsible for executing and managing a process, there are two other relevant participants: suppliers and customers. Suppliers are responsible for triggering the start of your process and customers are the ones who receive the outcome. So as important as identifying where and when a process starts and ends, it’s equally important to identify who the key people involved in this process are.
4. Establish the process boundaries
Identify where or when the process starts and its activities/triggers (inputs) and where or when it ends and what the final result is (outputs). Sometimes a process has more than one end, so it’s important to map all of them out to determine all possible outcomes. An example of process boundaries include:
- For a recruitment process, the input is an application to the open position and the output is either a selected candidate on an archived CV.
- For a bug tracking process, the input would be a new bug found; and the output a bug solved.
5. List and order the actions
Now that you know where things start and end, it’s time to list the steps in between. Use an action verb to describe each step or task. You can either keep it high-level or go into detail. Here is an example of what this would look like for a purchase process:
- Fill out a purchase request form
- Review the request
- Ask for a quote from three different suppliers
- Choose the best quote
- Send the purchase request and best quote to the requester’s manager for approval.
- If approved, send the purchase order to the supplier and pay; if rejected, alert the requester.
- Wait for the product to be delivered
- Evaluate supplier services
6. Determine business process rules and handoffs
Business rules are conditions that make decisions easier. An example of a business rule is if a sales opportunity is bigger than $10,000, a senior account executive should be assigned as a reviewer; or if a purchase request is lower than $10,000, it does not need an additional reviewer. A handoff represents a change of responsibilities between teams. For example, when someone buys your product, there is a handoff between the sales and customer success departments.
To complete this step, you’ll need a deep knowledge of the process, the business strategy, and how things connect and correlate.
7. Review your process map and optimize
Once your flowchart is done, analyze the information you’ve gathered and determine if the process is actually running the way it’s supposed to. As you review, ask questions like:
- Are the correct people involved in the process?
- Are the people involved in the process actually following the ideal flow?
- Are there any missing or redundant steps that could be added or eliminated?
8. Repeat for continuous improvements
Making gradual process improvements is the key to running efficient and goal-oriented processes. After you finish process mapping, it’s essential to follow up on your process execution so you’re headed in the direction of continuous improvement.
How to use process mapping symbols

Using a unified modeling language, like process mapping symbols or flowchart symbols, is a great way to map and illustrate the flow of many types of business processes. These symbols provide a standardized and universal language that simplifies mapping and communicating the full scope of a business process, including:
- The start and end of a process.
- All the tasks, activities, and actions required to complete a process to produce an outcome.
- The flow of documents.
- The flow of data or information between apps, systems, departments, and people.
- A decision flow, or a graphical representation of different courses of action and their outcomes.
- A flowchart that illustrates the flow of information or work between systems.
- The activities, tasks, and processes necessary to develop a new product.
- The tasks and activities that must be completed in order to produce a specific outcome.
Learn more about common process mapping symbols, meanings, and examples.
Common process mapping examples
There are many different ways for you to build process documentation to design a process. You can use flowcharts, diagrams, mind maps, or whatever your creativity suggests, but there are some widely used and recognized methodologies out there.
Below are the most common process mapping examples to help guide your business process mapping:
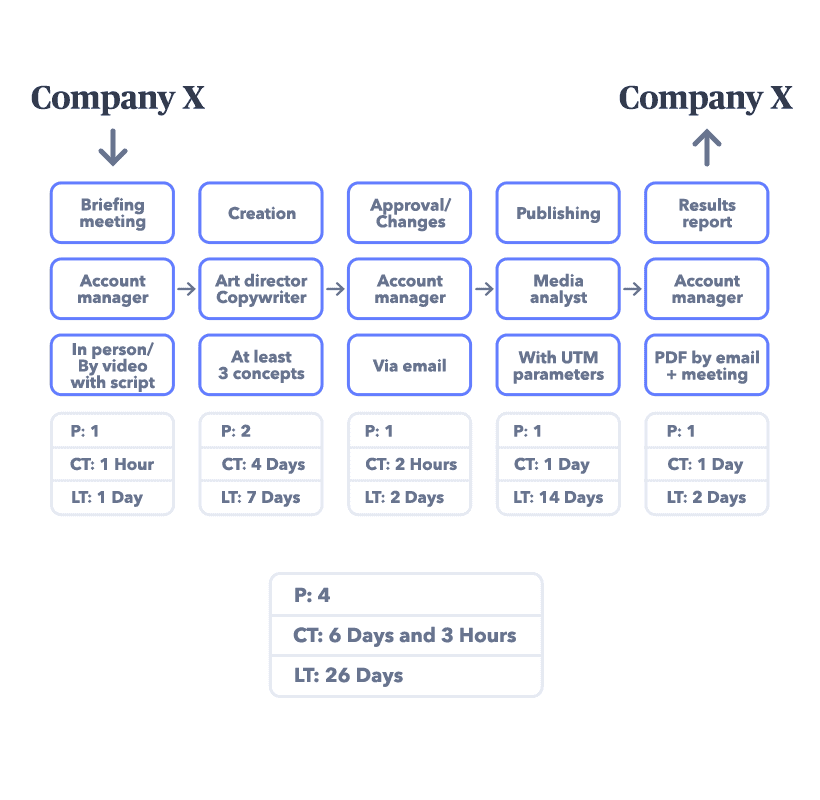
Value stream mapping (VSM) diagram
A VSM diagram is one of the seven Lean principles, a methodology that continually seeks to improve business processes by mapping the value of a business process. It is a visual representation of all interactions you have with your customer and the value delivered by each interaction.
For example, if the value is everything your customer is willing to pay for, think about the steps you need to face in order to deliver this value.
A value stream map combines all those steps together, provides a big-picture visualization of all added value or wasteful practices, and allows you to analyze and identify ways to improve the value delivery process.
Here’s what a VSM looks like:
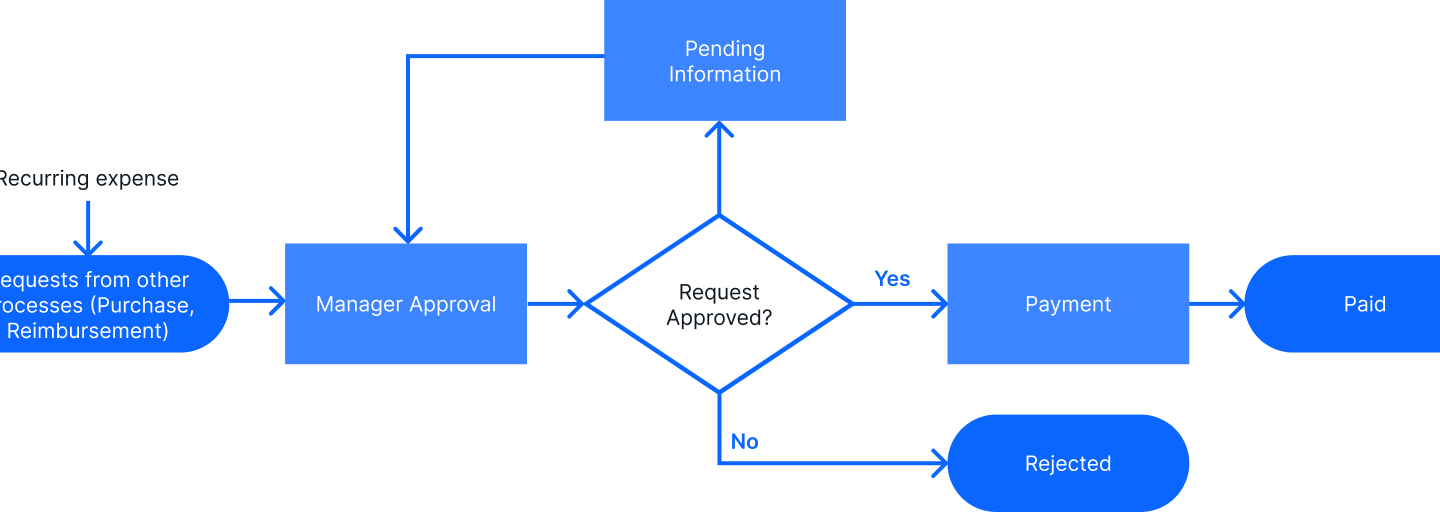
Business process model and notation (BPMN) diagram
BPMN is perhaps the most commonly used process mapping methodology and uses flowchart symbols to create a graphic representation of the process — like ovals for the start and endpoint, rectangles for tasks/steps, diamonds for decision points, and arrows to mark the process direction flow.
The final result is something like this:

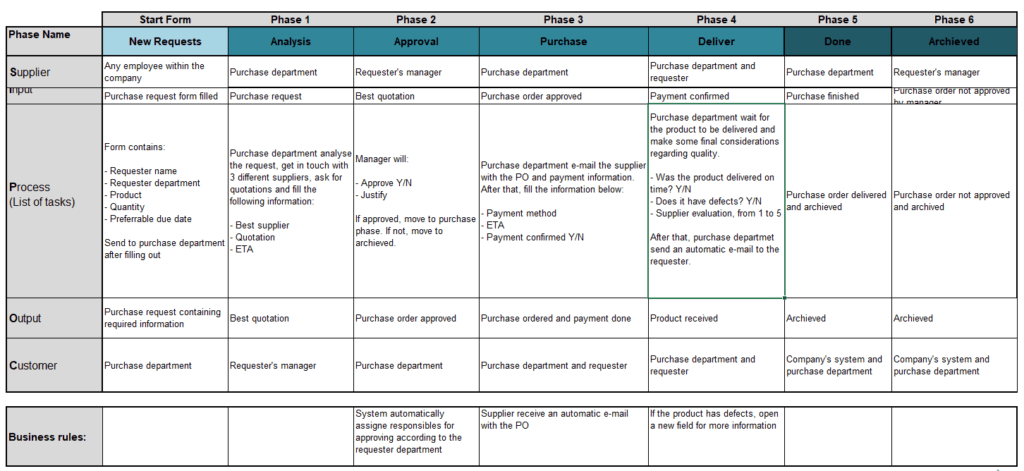
Supplier, input, process, output, and customer (SIPOC) diagram
A SIPOC diagram is a high-level process map that results in a very detailed diagram. It looks difficult at first, but it’s one of the most intuitive and practical ways to quickly understand the phases of a process when things start and end with inputs and outputs.
To create and understand a SIPOC diagram, apply these prompts across every phase to better understand the purpose of its flow:
- Supplier: who inputs the information to start the process?
- Input: what does this person input?
- Process: what do you do with this information?
- Output: what is the result after processing it?
- Customer: who did you deliver that processed information to?
Below is the framework of what a SIPOC diagram looks like when it’s implemented:
Swimlane process map
A swimlane process map is helpful for tracking work that moves back and forth between teams or departments. This can include tasks, documents, information, and more. As the name implies, the chosen process is mapped from left to right and looks like a pool swimlane. Here’s how it works:
- To the left, all the different actors involved in the process are listed. They provide the trigger that kicks off the process.
- To the right, is the end result of a process.
- In the center are the actual swimlanes. Each swimlane represents a workflow that includes how the work travels from team to team or person to person. Flow lines and icons are used to map the nature of a task at certain points and how it makes its way from the left side of a swimlane to the right.
For a simple process, it’s common to only include one swimlane. For more complex processes, it’s common to stack multiple swimlanes so as to map all the various subprocesses involved. Below is an example of how to map a complex process using a swimlane diagram:

Flowcharts
A flowchart is a snapshot of all the steps and decisions that make up a workflow or process in sequential order. They can also be used to document the flow of data. Flowcharts are most commonly used to document and guide the creation of new workflows or processes, but they can also be used to improve the efficiency of existing workflows or processes.
Flowcharts are highly adaptable and can be used to document the flow of:
- Data (information between apps, departments, people, and systems).
- Documents (movement of documents throughout a process or workflow.).
- Processes (tasks and/or activities that need to be completed to produce an outcome or output).
- Workflows (tasks and/or activities that need to be completed to reach an outcome within a process).
Learn more about flowchart symbols and examples to start building a flowchart of your own.
High-level process maps
As the name implies, a high-level process map is a high-level visualization of a process or workflow. High-level process maps don’t provide much detail and are ideal for quickly summarizing the basic steps of a process or workflow. For example, this is a high-level process map for a sales pipeline:

The steps are clearly defined and feature only the most essential information required to easily depict the flow of prospects through the sales pipeline.
Detailed process maps
Detailed process maps achieve the opposite of high-level process maps, and focus on providing as much detail as possible. A detailed process map is a great way to pinpoint process issues like errors and redundancies. A detailed process map includes information on:
- The expected outputs (what the process aims to achieve or produce).
- The type of input or quality of input that is required to kick off a process or workflow.
- Defined variables within a process or workflow (such as approvers or input from additional stakeholders).
- How a process should function.
This example of a detailed sales pipeline includes the same information as the high-level process map but with much more information, such as the information or actions required for each step, the flow of information, and expected outcomes.

Getting started with process mapping
If you’re creating your own process map in-house, consider using a low-code business process mapping template. A process map template can support you in mapping, evaluating, and managing your business processes quickly and without any coding or technical development.
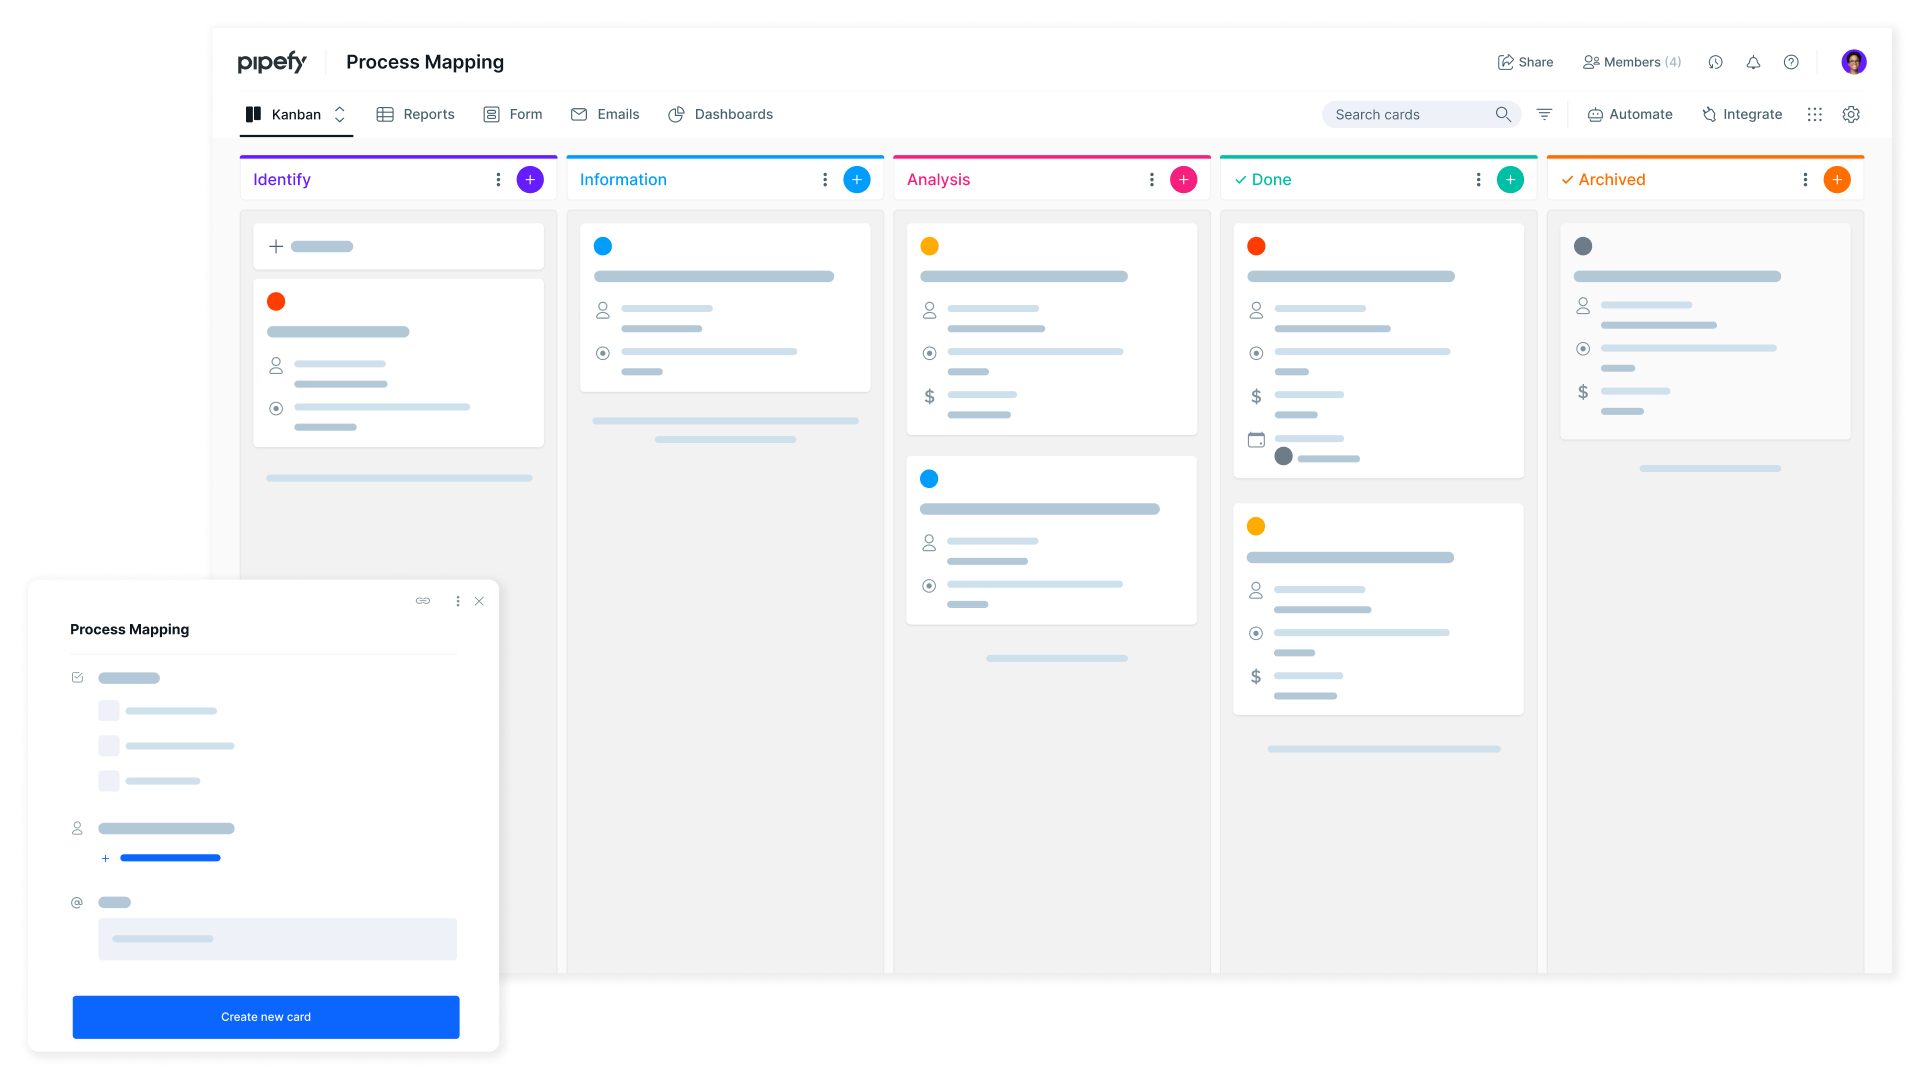
Use the process mapping template to gain end-to-end visibility of your process mapping steps, assign team members to deal with each activity required, and quickly spot the bottlenecks with SLA alerts, labels, reports, objectives, triggers, success metrics, and more.
Turn your process map into a process improvement plan with Pipefy
Mapping your process has many benefits, but one that can leave many stumped and wondering: What’s next? How do I share the information I’ve gathered and collaborate with everyone? Is process mapping enough to guarantee a standardized execution? How can I automate and optimize my processes with AI?
For this reason, process mapping is usually a precursor to setting up a workflow management tool, workflow engine, or business process management (BPM) (BPM) software like Pipefy.
With Pipefy, you can turn your process mapping exercise into a process improvement plan. Pipefy’s low-code BPM platform helps you track important KPIs, centralize your stack with integrations, and standardize and automate your business processes.
Keep reading to learn more about workflow management, AI and how a BPM like Pipefy can help take the guesswork out of running your business process.